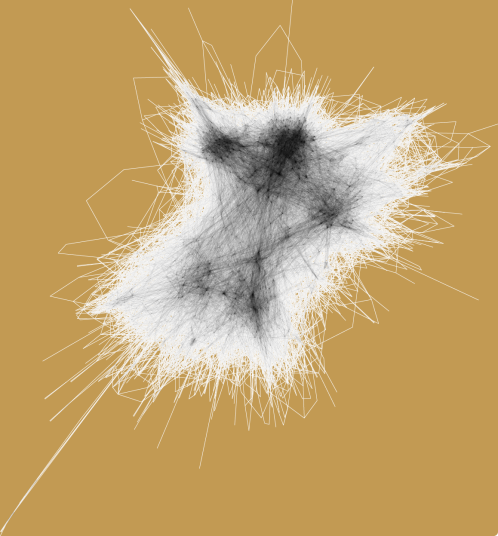
If you’re a network scientist, or you’ve hung around with one, you’ve probably heard about ridiculograms. It’s a tongue-in-cheek derogative word for plots of huge networks intended to impress by their complexity. I have a vague memory of someone crediting Marc Vidal for coining it. In this blog post, we will explore if they really are so ridiculous in a dialogue between myself and my Vidalesque twin from the land of shadows.
Graph visualizations actually do give a good feeling for the size and complexity of a networked system. Often you can understand the large-scale structure as well, thanks to the ingenuity of the visualization algorithms. You might just need to leave your program running overnight. Exhibit 1: A 8507 node network of patient flows between units of a regional health care system. Different geographic regions come out as clusters in the network.

Seriously man. What if the plot is just a structureless hairball? If you run it overnight and don’t see any structure, how can you be sure there isn’t any—you’d just have to run the program on a million-core quantum computer to see it?
If it is just a structureless hairball, isn’t that also interesting? For a large enough network, the kinds of structures that are visible in a ridiculogram are only mesoscopic anyway—community structure, core-periphery structure, other unnamed density fluctuations, . . There can be all kinds of other structures, which you have to measure with your netsci ninja skills. But yeah, it’s a bummer that most available software doesn’t tell you how well-converged the plot is. I use to mark some nodes, take screenshots, and check how much they differ as the hours go by.
Dude, now I understand why it is called ridiculogram! That’s like checking photos of the sky for Planet X . . Plus, if you rerun the program, you won’t see the same thing.
If you run those spring-relaxation programs twice, they don’t give precisely the same plots, but plots that provide the same impression.
That doesn’t sound very exact, does it?
They are, of course, complementary to the rest of the analyses. You are the kind of guy who thinks every plot in a paper has to correspond to one point you make in the text. Plots could be way more than that! If you write an article about a five-legged furry animal species you discovered, I guess you wouldn’t put a photo of it because it could just as well be described in the text . .
[here the dialogue spirals out of control and into profanities and violence]